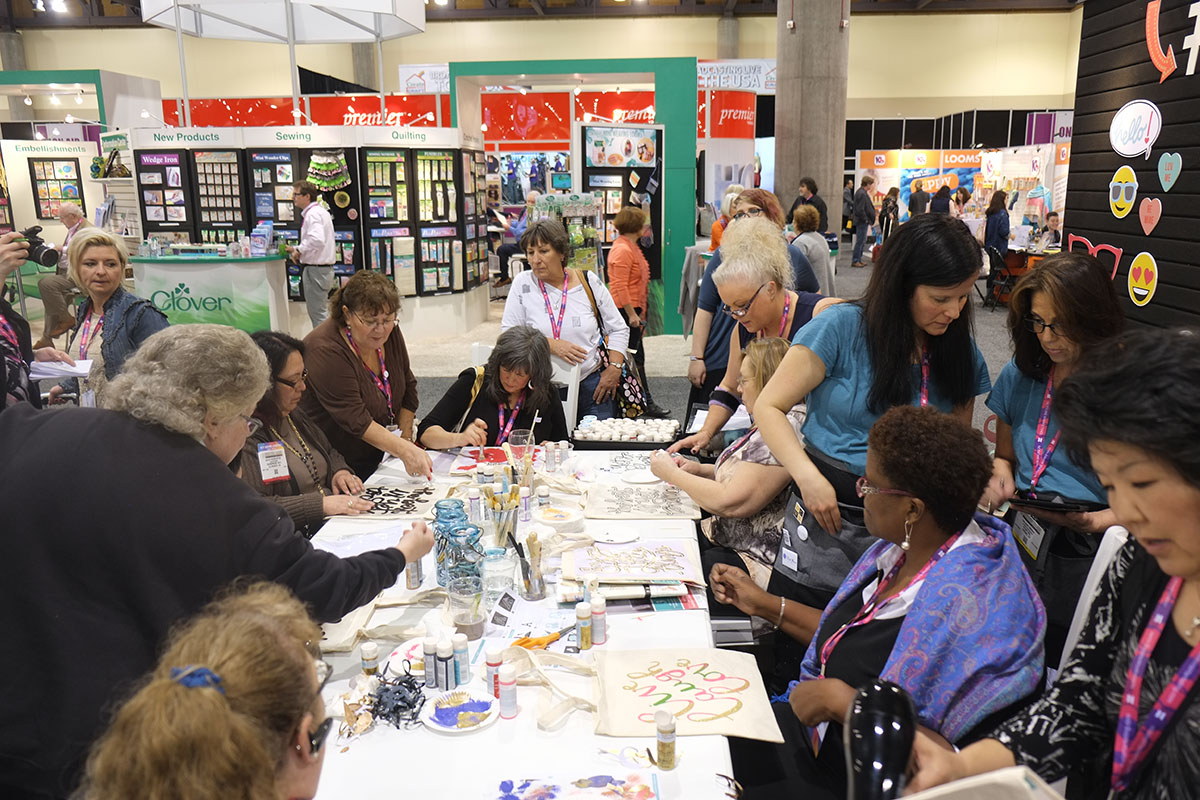
Creativation 2017 in Phoenix AZ.
Photo by Kristin Link
The new AFCI study, completed with market research firm MaritzCX, will be released in full to association members Feb. 1, but data collection is ongoing and updates are expected later this year. The study didn’t make direct comparisons between the data from 2011 and 2016, marketing and PR manager Kristen Farrell told me, because the research methods changed.
The study estimated the size of the U.S. creative industry by sampling nearly 10,000 residents and asking if anyone in their household had participated in any creative activities in the past 12 months — 64 percent said they had, up from 56 percent of households in 2010. The respondents shared which activities they’d participated in, for how much time, and how much they spent on their activities. The survey was conducted over the course of a year to avoid seasonality.
Respondents reported how much they spent on their activities, and that was extrapolated out to the American public. Creative activities were broken down into 10 major categories:
- Paper crafts (including traditional and digital scrapbooking, card making and Artist Trading Cards)
- Beads & jewelry
- Floral crafts
- Edible arts (including cake decorating, candy making and vegetable carving)
- Wood crafts & home décor
- Knitting & crocheting
- Needle arts (including cross-stitch, embroidery, weaving and needle felting)
- Sewing & fabric (including quilts, apparel and home décor)
- Painting & drawing (including paints, inks, pastels, charcoal, pencil, watercolors, calligraphy and printmaking)
- Kids crafts
- Other (includes any activities not explicitly included in other categories, holiday crafts, or mixed-media projects, such as candle making, stenciling and doll making.
The biggest takeaways
Crafters are younger than the average American
“The DIY movement probably inspired a lot of the younger generation,” Farrell says. Seeing creative activities on social media encourages people to build their creative confidence.
US Crafters by Age

Cross-category participation is major
Creative people don’t stick to just one area. While 63% of households reported participating in at least one craft activity, a quarter of households participated in five or more activities in the past year.
Households by Participation

Makers are dedicated
People spend a lot of their time on their craft activities: Half report spending 5 to 20 hours per week on creative projects. Another 40 percent spend more than 20 hours per week on crafting. Only 10 percent commit less than 5 hours per week to making things.
Time Spent Crafting

Men are makers, too
AFCI believes male participation and Hispanic participation in creative activities were underreported in past studies. The new report shows that while 16 percent of the total people surveyed were Hispanic, 20 percent of crafters were Hispanic. And two craft areas near gender parity are painting and drawing and wood crafts and home décor:
U.S. Crafters by Gender

Crafters aren’t afraid to try something new
Perhaps because there is so much cross-category participation, many makers identified themselves as “beginners.” This points to major opportunities for education:
Experience Level by Activity

Interest is growing
Most crafters anticipate spending at least as much or more time this year as last year on their creative endeavors.
Anticipated Change in Participation


Grace Dobush
contributor
Grace Dobush is a freelance journalist and the author of the Crafty Superstar business guides. She’s also the co-organizer of Crafty Supermarket, an indie craft show. Grace has written for many print and online publications including Wired, Quartz, The Economist, The Washington Post, Writer’s Digest, and Cincinnati Magazine. She’s also worked on the editorial staffs of HOW, Print, Family Tree Magazine, The Artist’s Magazine and the Pittsburgh Tribune-Review.

Thanks for the fabulous graphs. They make the content easy to digest at a glance.
Grace made them using Infogr.am. It’s a neat online software that helps you easily display information visually. Highly recommend!
What does the numbers at the bottom of the infogram mean?
I’m sorry, can you clarify? Which number are you referring to?
at the bottom of the charts 1 10 20 30 40 50…..
All of the numbers at the bottoms of the charts are percentages. The last chart’s percentages refer to the overall proportion of people who do crafts who do that specific craft, divided by level of interest.
Your data confirms my observations over the past two years. Interest in DIY – crafts is growing and people are looking for new things to learn that aren’t too difficult and don’t cost a lot to explore. Teachers are in demand and classes serve as both as both learning environments and social events. My company specializes in sashiko pre-printed samplers / quilt blocks. Sashiko is big in Great Britain and Australia – just starting to grow in the US.
Really interesting, thank you. Your article was useful for me even though I am working in the UK. That idea of people describing themselves as ‘beginners’ is important for pattern and instruction writers like myself. I’ve found that often too much knowledge is assumed in patterns for crafts – and obviously try to do things differently myself!
Thanks for the great study. Would it be possible to receive a report where the 44 billion are broken down by the 10 categories?
Thank you very much and best from Germany, Axel.
Would love to know the percentage of sales online vs brick and mortar, also percentage of sales to big box stores vs small retailer.
It’s a double edged sword…I just rec’d notice that Amazon Handmade added a new category. The bigger the craft industry grows, the more likely it will become a target for the giant mega stores.